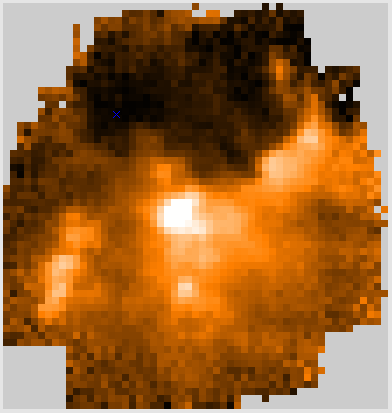
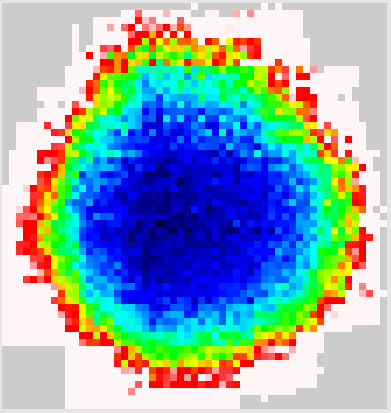
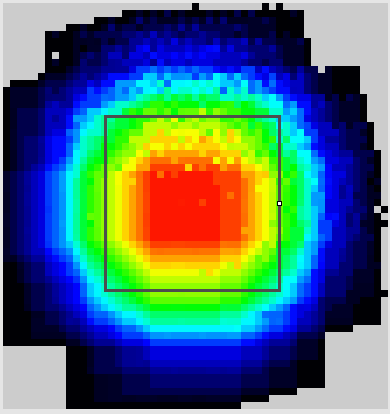
Note: When HARP has only 12/16 receptors available smooth maps are archived best using 1/8 array spacing or half beam spacing. Unless smoothing do not go below 1/4 array spacing.
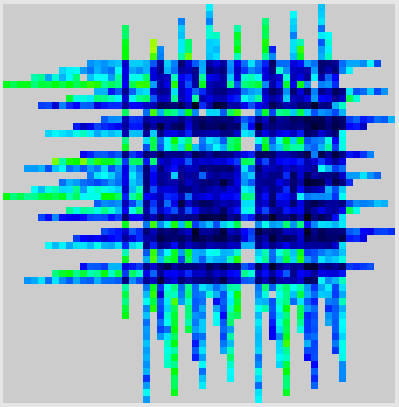
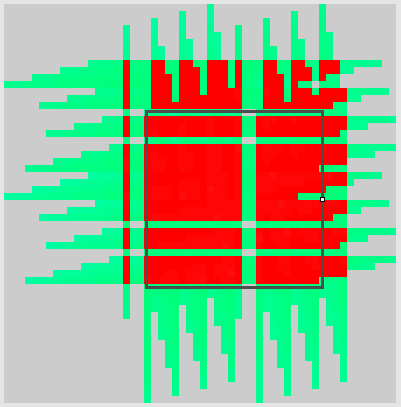
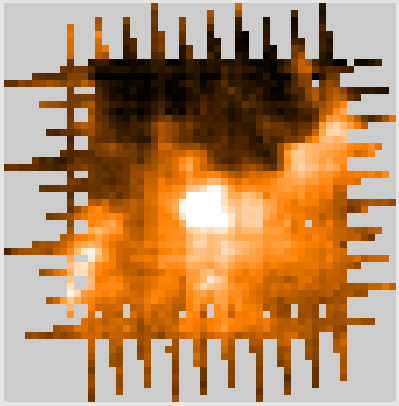
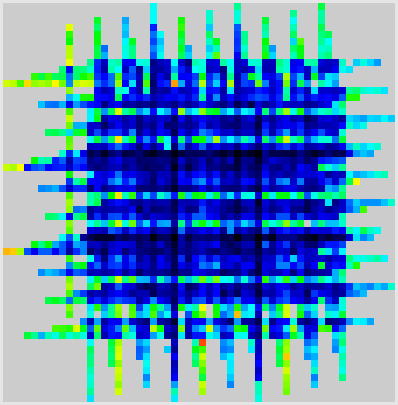
Below is a comparison of HARP raster observations made with all different Scan Spacings which are available in the OT.
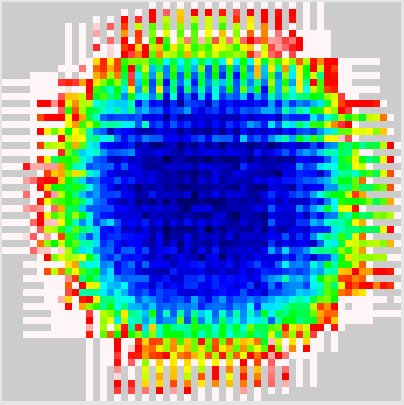
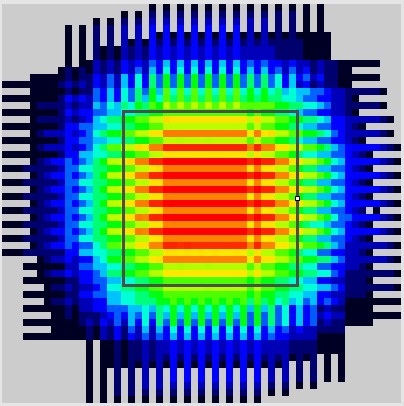
All observations made towards NGC7538IRS1 180×180 arcsec (basket weaving) on 20160608 (scans 70 – 94), CO(3-2) bandwidth 1000 MHz.
Observing times are from FITS header (DATE-END – DATE-OBS).
For comparison are given times from the OT and the ITC
The intensity scale is the same in all plots (rms 0.5 – 2.0 K; time 0.5 – 17 sec).
The figures show the following:
Left: Integrated intensity
Middle: RMS
Right: Effective integration time (EFF_TIME)
Color codes for the integration times:
Red-orange: 13.3 seconds
Yellow: 10.9 seconds
Green: 9.0 seconds
Light blue: 6.2 seconds
Dark blue: 3.0 seconds
Black: 1.0 seconds
The black square indicates the approximate size and location of the requested 180″x180″ field
Average rms within 180″x180″ field:
1 array overlap: 0.80 K (minimum 0.54 K; maximum 1.31 K)
3/4 array overlap: 0.76 K (minimum 0.48 K; maximum 1.48 K)
1/2 array overlap: 0.73 K (minimum 0.55 K; maximum 1.19 K)
1/4 array overlap: 0.80 K (minimum 0.60 K; maximum 1.46 K)
1/8 array overlap: 0.75 K (minimum 0.58 K; maximum 1.10 K)
1 sample overlap: 0.78 K (minimum 0.56 K; maximum 1.17 K)
Scan 70, 71; 1 array overlap; 2 sec; 4:24 + 4:23 = 8:47; OT 10:30; ITC 5:19
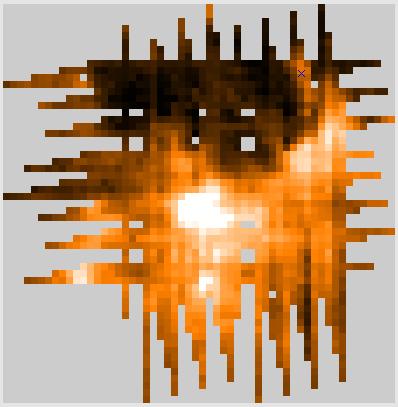
Scan 73, 76; 3/4 array overlap; 1.5 sec; 4:53 + 4:57 = 9:50; OT 11:55; ITC 6:03
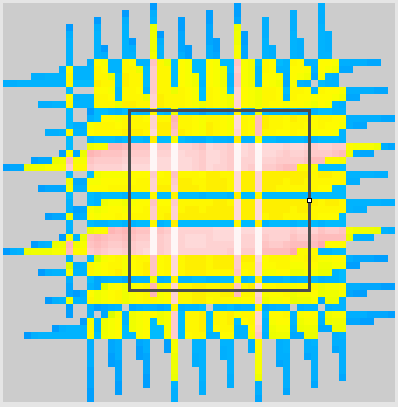
Scan 77, 79; 1/2 array overlap; 1 sec; 4:47 + 4:51 = 9:38; OT 11:42; ITC 5:55
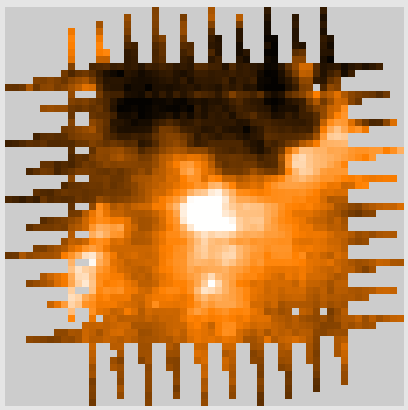
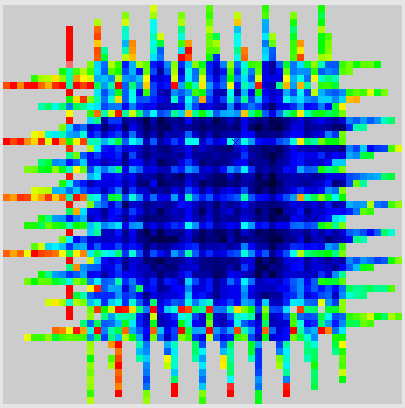
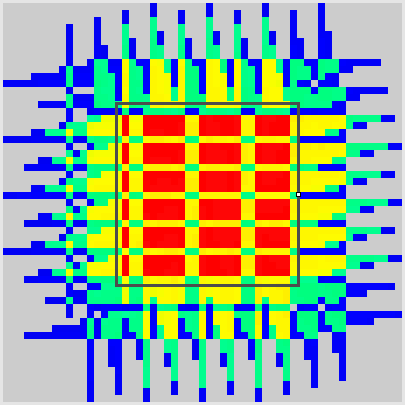
Scan 91, 92; 1/4 array overlap; 0.5 sec; 5:15 + 5:19 = 10:34; OT 12:40; ITC 6:24
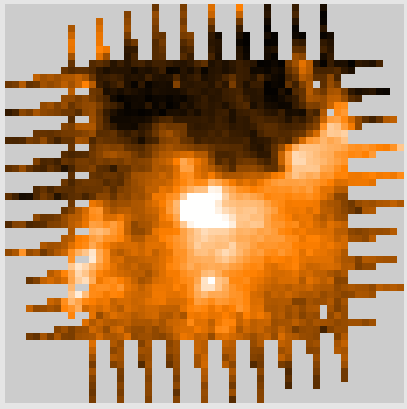
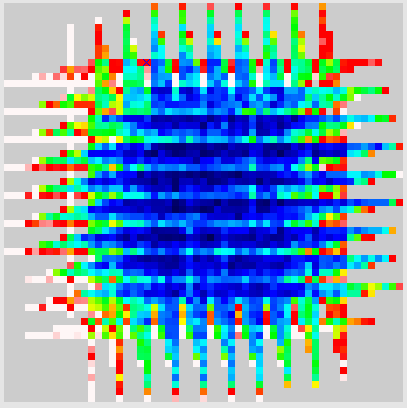
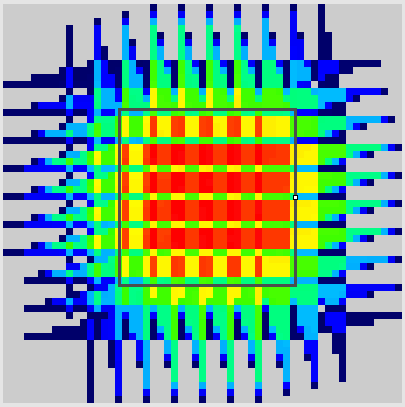
Scan 81, 87; 1/8 array overlap; 0.25 sec; 5:45 + 5:56 = 11:41; OT 15:51; ITC 7:59
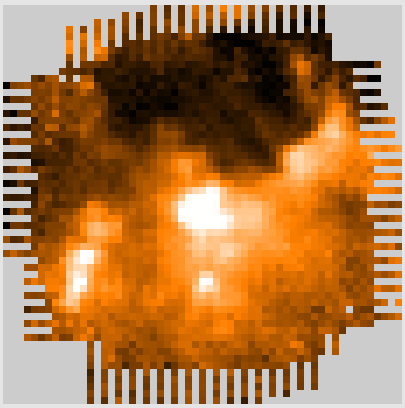
Scan 94, 96; 1 sample overlap; 0.125 sec; 7:50 + 7:57 = 15:47; OT 22:50; ITC 11:29
